Pearson Edexcel · GCSE · Mathematics
Course version: 1MA1 · Version from Mar 2026
Interpret, analyse and compare the distributions of data sets from…
Full specification wording
Statistics: interpret, analyse and compare the distributions of data sets from univariate empirical distributions through: • appropriate graphical representation involving discrete, continuous and grouped data, including box plots • appropriate measures of central tendency (median, mean, mode and modal class) and spread (range, including consideration of outliers, quartiles and inter-quartile range) (Higher tier)
This topic involves analysing and comparing univariate data distributions.
Checked against the Pearson Edexcel 1MA1 specification (opens in a new tab) on .
- Point 5 of 7
- 4 key terms
Study notes
From the checked teaching notes for this specification point.
The idea
This topic involves analysing and comparing univariate data distributions. You must use appropriate graphical representations: for discrete data, use bar charts or pictograms; for continuous or grouped data, use histograms or frequency polygons. Box plots are used to visualise the five-figure summary: minimum, lower quartile (Q₁), median (Q₂), upper quartile (Q₃), and maximum. Key calculations include measures of central tendency (mean, median, mode/modal class) and spread (range, inter-quartile range/IQR = Q₃ - Q₁). Outliers, extreme values that lie outside the main data distribution, can be identified using rules like being more than 1.5 × IQR below Q₁ or above Q₃. A core skill is comparing two distributions by commenting on both a measure of location (e.g., median) and a measure of spread (e.g., IQR), always interpreting your findings in the context of the data.
What earns the marks
- Calculate measures of central tendency (mean, median, mode, modal class) and spread (range, quartiles, IQR) from lists and frequency tables.
- Draw and interpret appropriate diagrams, including bar charts for discrete data, histograms and frequency polygons for grouped/continuous data, and box plots.
- Compare two distributions by commenting on a measure of central tendency (e.g., median) and a measure of spread (e.g., IQR), ensuring comments are contextualised.
- Identify outliers using a given rule (e.g., values more than 1.5 × IQR below Q₁ or above Q₃) and explain their effect on statistical measures like the mean and range.
Common mistakes and how to put them right
Forgetting to use midpoints when estimating the mean from a grouped frequency table.
Put it right: The estimated mean is calculated as Σfx / Σf, where 'x' is the midpoint of each class interval.
Confusing the mode with the highest frequency.
Put it right: The mode is the data value or class interval with the highest frequency, not the frequency value itself.
When comparing distributions, just stating calculated values (e.g., 'The median for A is 25 and for B is 30').
Put it right: You must interpret this in context (e.g., 'On average, group B's scores were higher than group A's because their median was higher').
Exam tips
- When comparing distributions (e.g., from box plots), always compare a measure of average (like the median) and a measure of spread (like the IQR). Then, explain what each comparison means in the context of the problem. For example, a smaller IQR means the data is more consistent.
- The mean is affected by outliers, whereas the median and IQR are resistant to them. Choose the median as the most appropriate average if the data contains extreme values.
Try the lesson
The start of the Statistics: interpret, analyse and compare the distributions of data sets from univariate empirical distributions through: • appropriate graphical representation involving discrete, continuous and grouped data, including box plots • appropriate measures of central tendency (median, mean, mode and modal class) and spread (range, including consideration of outliers, quartiles and inter-quartile range) (Higher tier) lesson, made from checked teaching notes for this specification point.
Have a go first
A box plot has lower quartile 18, median 25 and upper quartile 34. Work out the inter-quartile range.
See it
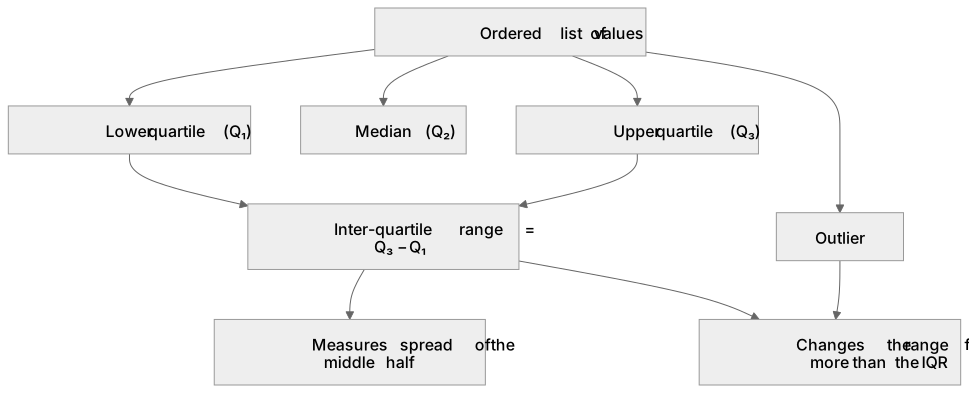
Key words
Say what each word means before you turn the card.
Box plot
Try answering aloud or in your head before turning the card.
Inter-quartile range
Try answering aloud or in your head before turning the card.
Outlier
Try answering aloud or in your head before turning the card.
Modal class
Try answering aloud or in your head before turning the card.
See every definition
- Box plot
- A diagram used to visualise the five-figure summary: minimum, lower quartile (Q₁), median (Q₂), upper quartile (Q₃), and maximum.
- Inter-quartile range
- A measure of spread calculated as Q₃ - Q₁, measuring the spread of the middle half.
- Outlier
- An extreme value that lies outside the main data distribution, identifiable using rules like being more than 1.5 × IQR below Q₁ or above Q₃.
- Modal class
- A measure of central tendency: the class interval with the highest frequency.
Label the diagram
Some boxes have lost their names. Pick the right name for each number.
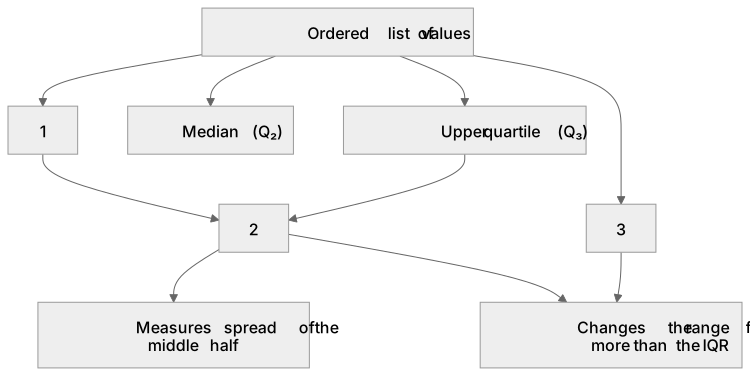
1Box 1
2Box 2
3Box 3
There is more to this lesson
The full lesson goes on to check your understanding and help you earn the marks. Create a free account to carry on, with your progress saved.
A week of Premium from your first lesson · Then the free plan continues · No card, no charge
Test your understanding of Statistics: interpret, analyse and compare the distributions of data sets from univariate empirical distributions through: • appropriate graphical representation involving discrete, continuous and grouped data, including box plots • appropriate measures of central tendency (median, mean, mode and modal class) and spread (range, including consideration of outliers, quartiles and inter-quartile range) (Higher tier)
Active recall beats re-reading. Take an instant quiz now to test what you’ve learned and lock it into long-term memory.
A week of Premium from your first lesson · Then the free plan continues · No card, no charge